
The Our World in Data changed the excess deaths calculations method, creating a big gap between the new and the traditional estimates.
Two of the most important variables to look at during a pandemic are the Total Excess Deaths per capita and the age-adjusted excess deaths between countries.
They are less vulnerable to bias because one death is the same in every country, which is not the same as looking at Covid-19 deaths, that can change between countries.
Excess deaths is a very important indicator that shows the impact of a pandemic in terms of deaths. Not only the deaths from the agent (virus, bacteria) , but also how policies, measures and public communication have influenced the number of deaths.
Our World in Data (OWD) is one of the most consulted and shared platforms because it has a lot of information and graphics available to everyone, that you can access and share. They are seen as a very objective and reliable source but we found a gap between their data and the official reports “penalizing” Sweden and “benefiting” Finland and Denmark.
There is a subject of interest that is the comparison between nordic countries since Sweden is known for having no lockdowns, no mask mandates, no general school closures and no vaccine mandates.
Denmark, Norway and Finland had lockdowns in the beginning of the pandemic, although months after they approached the policy of Sweden, but still it is a popular comparison to show that lockdowns did or did not work.
On OWD, when we compare the excess death, we can see a huge gap (image 1) with Sweden having a worse result with an excess deaths of 8.447 and only Finland having excess deaths (1.313). Per million we have the same situation. This is available in the OWD database.


If we look at the database of Sweden in SCB and we calculate the total excess deaths against the average deaths of 2015-2019, from the start of 2020 to October 2021, we see a much smaller excess deaths: 6.515 deaths against the 8.447 of the OWD.

For Denmark and Finland we find the opposite effect of Sweden:
Their excess deaths in OWD is -124 and 1261.
But from official databases Denmark has 2.649 excess deaths and Finland 3.423
(against the 2015-2019 average).
The official data when we compare it to the average 2015-2019 gives us a totally different picture:
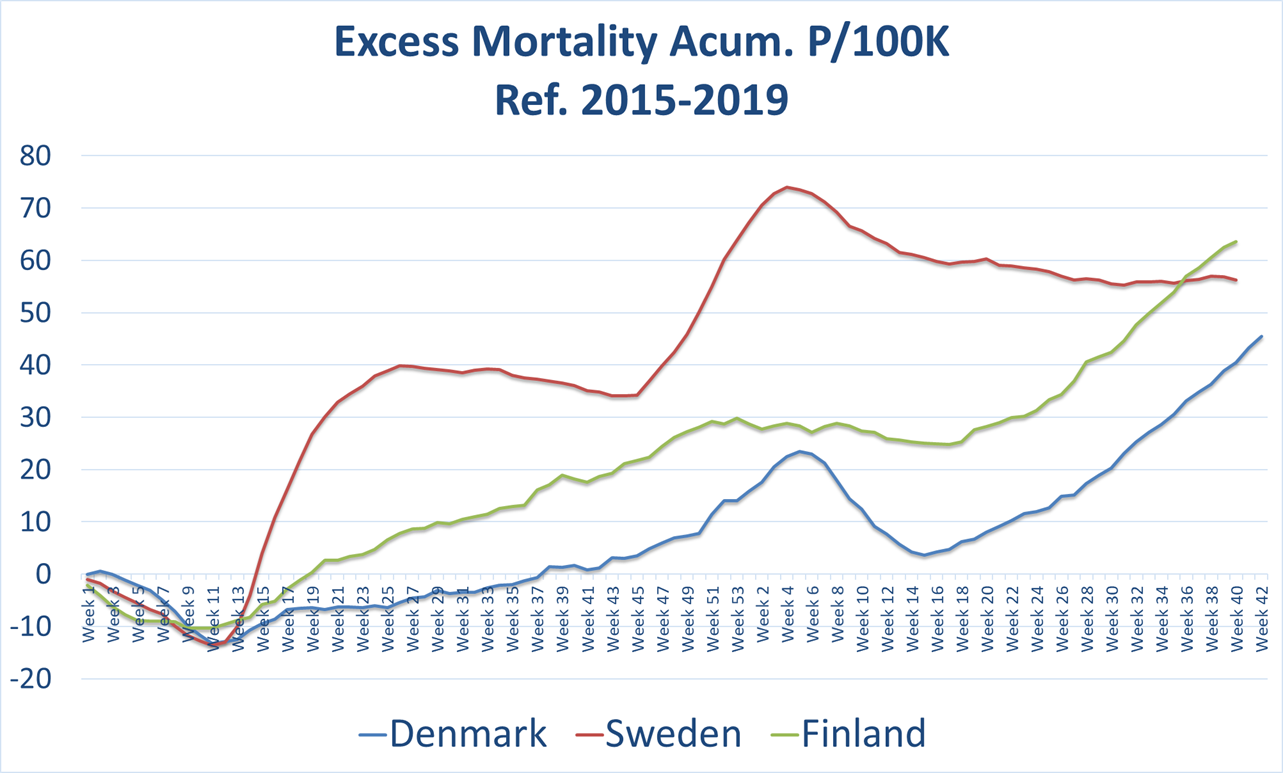
Finland has an excess deaths higher than Sweden per 100.000 and Denmark is close.
But why this big difference? Why does Sweden in OWD have a higher excess deaths and Denmark or Finland have a lower excess mortality than the official data?
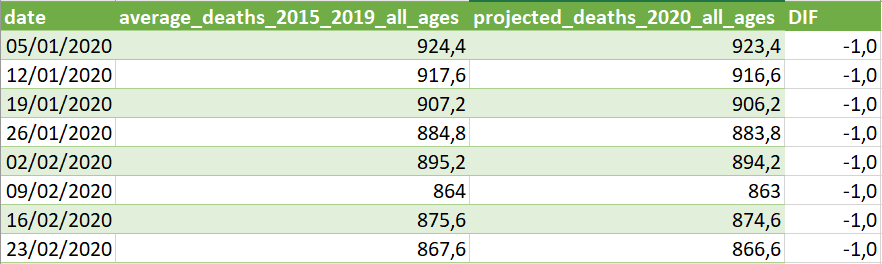
We noticed there was a change on 20 September 2021 in the method that OWD uses to calculate the excess deaths. Instead of comparing the current mortality to the average from 2015-2019, they compare it to the “Projected Deaths”, a regression model based on the last five years.
What is the impact of this?

The difference between the “projected” deaths and average 2015-2019 in Sweden is approximately -16 every week, so in 2 full years this method gives 1.714 more excess deaths than using the 5 year average.
We can see that effect in the graphic:

Finland and Denmark on the other hand have, respectively, 21,2 and 30 deaths difference per week, increasing the expected deaths “projected” against the average.


In two full years, this allows Finland and Denmark to have, respectively, 2.247 and 3.180 less excess deaths. In the case of Denmark, a deficit is granted by this “projection”.
Taking into account that Sweden has almost twice the population of each of these countries, this has a huge impact on the excess deaths per million.
An interesting detail, Norway which is the country with no excess deaths is neither benefited or penalized by this OWD “projection”, with just -1 per week difference to the average. This gives a negligible excess of deaths in two years of 106 deaths over the 2015-2019 average.
This is a matter of great interest. OWD is well known and used by many to support health and political decisions that affect millions of people.
We have to notice that although there are excess deaths in these three Nordic countries (with the exception of Norway), they are still the lowest in Europe even with deaths “projected” in OWD for Sweden.
Conclusion
A change with a significant impact on the numbers in the middle of a pandemic should be well thought out.
In this case, there is a considerable difference in how the “Projected Deaths” affect the excess mortality compared to the conventional method that used the five previous years’ average before the pandemic. In this particular case, this change affects Sweden and benefits Finland and Denmark.
We need to look further and investigate how the regression model is applied to other countries. We will try in the coming days to get more information on the subject.


